Enlarge your debugger
Jorge "slack" Gorbe
ResaCON 2012
But... why?
It's 2012. Why the fuck are you talking about gdb?

Well, maybe...

You love Richard Stallman (isn't he lovely? :D)
Well, maybe...

You think IDEs are complex amalgamations of state, hard to understand, and prone to fail in unexpected ways
Well, maybe...

Let's talk about gdb anyway

GDB is extensible
- You can automate things
- You can adapt it to your code base
- You can try crazy new ideas :D
OLD extension points
- Breakpoint actions
- Canned sequences as commands
- Hook pre and post execution of gdb commands
- .gdbinit for autoloading
Nothing impressive here

Breakpoint actions
break myfile.cpp:99
Breakpoint 1 at 0x401193: file myfile.c, line 99.
(gdb) commands
Type commands for breakpoint(s) 1, one per line.
End with a line saying just "end".
>silent
>print a
>cont
>end
That cont screws single-stepping (solvable with Python, see this blog post)
Canned sequences (1/2)
define plist
    set $ptr = $arg0
    while $ptr != 0
        print *$ptr
        set $ptr = $ptr->next
        end
    end
Canned sequences (2/2)
A more complex example, from PpluX's SLB repo
define luastack
    set $top = lua_gettop($arg0)
    set $i = 1
    while $i <= $top
        if lua_type($arg0,$i) == -1
            printf "stack - %i : No Value \n", $i
        else
            call lua_pushvalue($arg0,$i)
            set $str = lua_tolstring($arg0,-1,0x0)
            set $type = lua_typename($arg0,lua_type($arg0,$i))
            if $str
                printf "stack - %i : %s -> '%s'\n", $i, $type , $str
            else
                printf "stack - %i : %s\n", $i, $type
            end
            call lua_settop($arg0,-2)
        end
        set $i = $i + 1
    end
Command hooks
You can also create hooks which run just before or after any gdb command:
-
define hook-commandto run things beforecommand -
define hookpost-commandto run things aftercommand
Enter Python
- GDB 7.x has (optionally) an embedded Python interpreter...
- ...and a Python API
 (there are still some quirks here and there, but it's quite usable :D)
NEW Extension points
- Pretty printers
custom representation of data structures - Custom commands
can even define custom parameters to be set via gdb'sset parameter valuemechanism - Some more auto-loading points
e.g. load pretty printers when a library is loaded - Event handlers
stop, cont, exited, new_objfile - "Convenience functions"
hook expression evaluation, e.g. define
$caller_is(string)and thenbreak file:line if $caller_is("main"), see this article with a implementation of $caller_is()
Python in GDB
Hello World
(gdb) python print "Hello, World!"
Hello, World!
Ok, now what?
Pretty printing
Friendly representation of your data structures
(gdb) p m
$3 = {
  _M_t = {
    _M_impl = {
      , std::allocator > const, int> > >> = {
        <__gnu_cxx::new_allocator, std::allocator > const, int> > >> = {}, },
      members of std::_Rb_tree, std::allocator >, std::pair, std::allocator > const, int>, std::_Select1st, std::allocator > const, int> >, std::less, std::allocator > >, std::allocator, std::allocator > const, int> > >::_Rb_tree_impl, std::allocator > >, true>:
      _M_key_compare = {
        , std::allocator >, std::basic_string, std::allocator >, bool>> = {}, },
      _M_header = {
        _M_color = std::_S_red,
        _M_parent = 0x604120,
        _M_left = 0x6040b0,
        _M_right = 0x604190
      },
      _M_node_count = 4
    }
  }
}
Pretty printing
Friendly representation of your data structures
(gdb) p m
$2 = std::map with 4 elements = {
  ["blah"] = 2,
  ["lolailo"] = 3,
  ["trololo"] = 1,
  ["xyz"] = 4
}
Pretty printing
Up-to-date libc versions have pretty printers for STL containers. You don't need to do anything to benefit from this RIGHT NOW.

Pretty printing
Of course, you can do it for your own data structures too: Writing a pretty printer
Pretty printer implementation
You need to define a class...
class StdStringPrinter(object):
    "Print a std::string"

    def __init__(self, val):
        self.val = val

    def to_string(self):
        return self.val['_M_dataplus']['_M_p']

    def display_hint(self):
        return 'string'
Pretty printer implementation
... and a lookup function
def str_lookup_function(val):
    lookup_tag = val.type.tag
    if lookup_tag == None:
        return None
    regex = re.compile("^std::basic_string$")
    if regex.match(lookup_tag):
        return StdStringPrinter(val)
    return None
And then do some boring stuff to register it into gdb
Custom commands (python version)
 # create a class for your new command
class DoNothingCommand(gdb.Command):
    """This command does nothing."""  # docstring (shown by gdb help command)
    def __init__(self):
        super(DoNothingCommand, self).__init__("do_nothing",
                                               gdb.COMMAND_USER,
                                               gdb.COMPLETE_NONE)
    def invoke(self, arg, from_tty):
        pass

DoNothingCommand() # and instance it
The Python API
Pretty much every gdb "user" concept is exposed to Python scripts via the API.
- Future goals (see this wiki page):
- make possible to support new languages using only Python
- make possible to write useful gdb-based stand-alone tools in Python
Demos
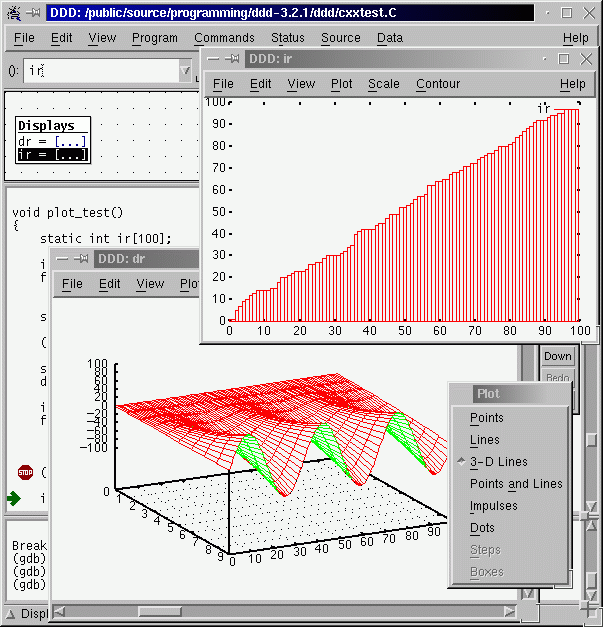
plotarray.py
Visualize an array from your program as a line graph:
import gdb
import matplotlib.pyplot as plt

class PlotterCommand(gdb.Command):
    def __init__(self):
        super(PlotterCommand, self).__init__("plot",
                                             gdb.COMMAND_DATA,
                                             gdb.COMPLETE_SYMBOL)
    def invoke(self, arg, from_tty):
        args = gdb.string_to_argv(arg)
        v = gdb.parse_and_eval(args[0])
        t = v.type.strip_typedefs()
        n = t.sizeof / t.target().sizeof
        l = [float(v[i]) for i in range(n)]
        plt.plot(l)
        plt.show()

PlotterCommand()
(simplified version)
Full source for this demo (try this at home!)view.py
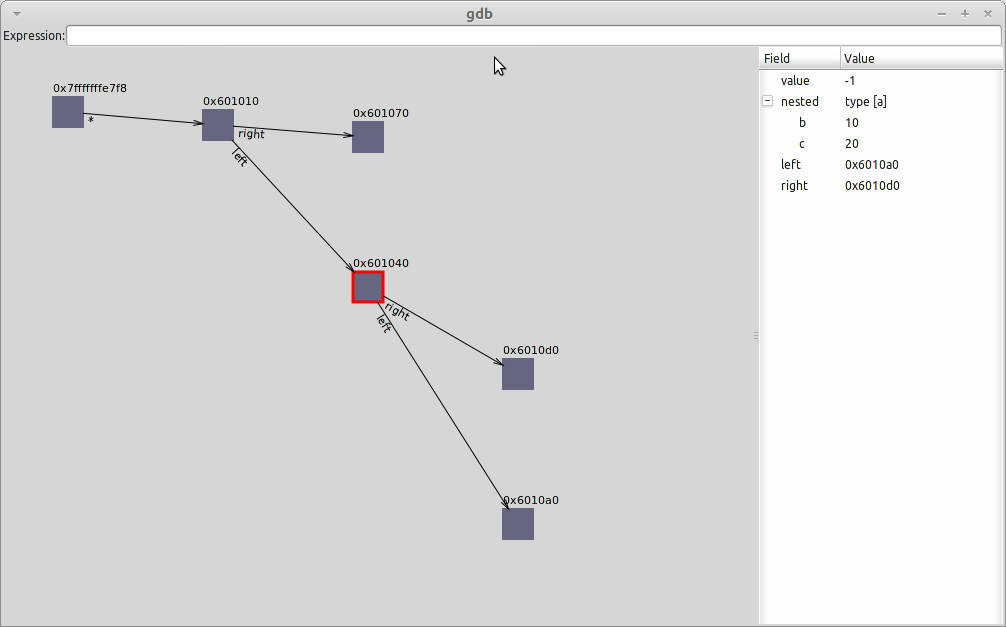
A (proof of concept) gtk data structure viewer:
Source for this demo (try this at home!)Not exactly new ideas...
DDD did these things ages ago.
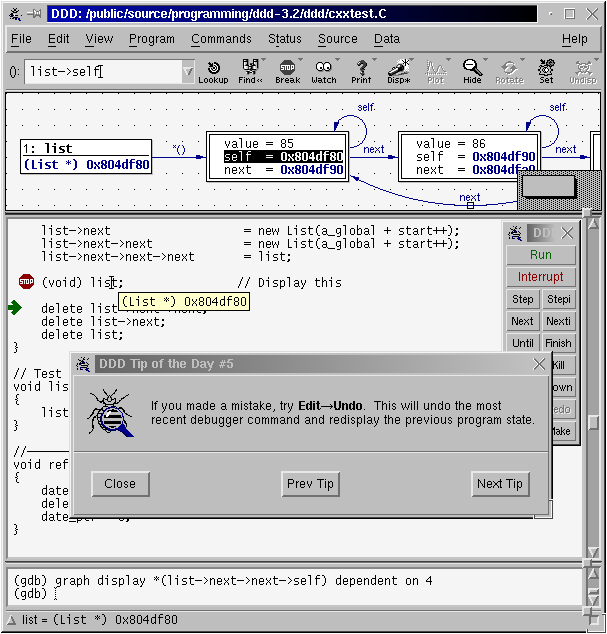
BROTIP: Andreas Zeller, original author of DDD, has a nice online course on debugging techniques at Udacity
Did you know...?
GDB has many other semi-unknown cool features (which I won't talk about today)
- Debug info in external files
Debug info can be moved from compiled objects to separate files, and still use it with gdb (like PDBs in VS) - Reverse debugging
GDB can record (some finite amount of) program history and perform backwards stepping/running. - JIT interface
A JIT can generate debug symbols and pass them on-the-fly to gdb to ease debugging (supported by LLVM!).
Wish list
-
Symbol and source server support
Central store for symbols of every build, so you can always retrieve the correct version automatically without distributing debug info to users. Also, integration with SCM to retrieve the matching source code. See Bruce Dawson's great post